9:36 AM The Stock Market Is Seriously Overvalued Based On This Benchmark | |
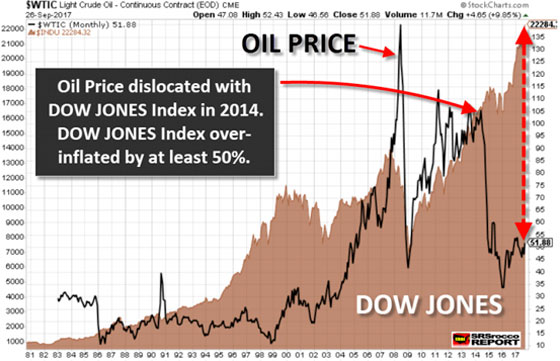
As Americans place a record amount of bets into a stock market that continues to rise towards the heavens, few realize how much the Dow Jones Index is overvalued. While some metrics suggest that the Dow Jones Index is very expensive, there is another indicator that shows just how much of a bubble the market has become. If we compare the Dow Jones Index to the price of oil, we can see how much the market has to fall to get back to a more realistic valuation. For example, if the Dow Jones Index were to decline to the same ratio to oil back to its low in early 2009, it would need to lose 14,500 points or 65% of its value. To get an idea just how overvalued the Dow Jones is compared to the price of oil, look at the chart below:
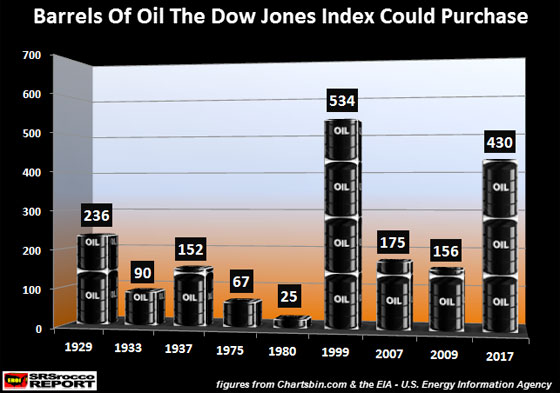
The oil price (BLACK line) increased with the Dow Jones Index (BROWN area) until it peaked and declined in 2008. Even though the oil price line overshot the Dow Jones by a wide margin in 2008, after it corrected and moved higher in 2010, both the Dow Jones and oil price moved up in tandem. If you look at the movement in the oil price and Dow Jones Index from its low at the end of 2008 to 2013, you will see just how similar the two lines moved up and down together. While the oil price shot up higher than the Dow Jones during the peaks (2010-2013), they paralleled each other quite strongly. THE BIG DISCONNECT: Dow Jones Index & The Oil PriceHowever, the BIG disconnect between the Dow Jones and the oil price took place when the price of oil fell from over $100 in the middle of 2014, to a low of $33 at the beginning of 2016. Currently, the Dow Jones Index will buy 430 barrels of oil. However, at the peak of the market in 2007, the Dow Jones Index could only purchase 175 barrels of oil:
We can see that the Dow Jones Index currently can buy nearly 200 more barrels of oil than it did at the peak before the stock market crash and Great Depression in 1929. At the depths of the Great Depression, the Dow Jones Index could only purchase 90 barrels of oil in 1933. Interestingly, the lowest ratio was reached in 1980, when the Dow Jones Index could only buy a mere 25 barrels of oil. The ultra-low Dow Jones-Oil Ratio in 1980 took place during the huge inflationary period as a result of two Middle East oil price shocks. In 1980, the price of oil reached $36.83 a barrel versus the average 902 points for the Dow Jones Index. However, after Fed Chairman Volcker raised interest rates to double-digits, the price of oil, gold, and silver plummeted over the next two decades. And by 1999, the Dow Jones-Oil Ratio surged to a high of 534.The high Dow Jones-Oil Rato came as a result of a low $19.34 oil price versus the Dow Jones Index average reaching a new high of 10,339 in 1999. Now, let’s explore what has occurred more recently. As the price of oil increased from 1999 to 2007, the Dow Jones-Oil ratio declined to 175, even though the market reached a new high of 14,200 points. Furthermore, during the first quarter of 2009 when the stock market collapsed to a low of 6,500, and the oil price fell to $42, the Dow Jones-Oil Ratio only declined to 155… 20 barrels less than at the peak in 2007.
Continue reading... (article source) | |
|
| |
| Total comments: 0 | |