11:47 AM Long Term Patterns in Stocks, Gold and Crude | |
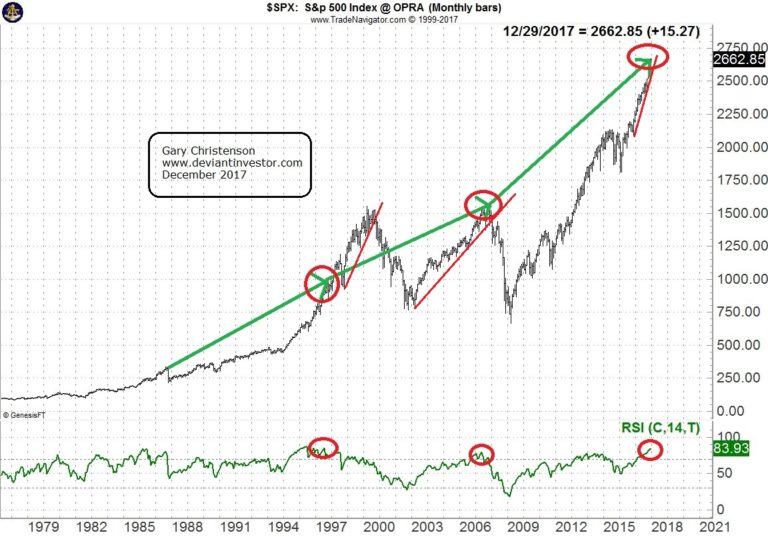
The pause in 1997 was not a top because the market rally extended into early 2000. The current peak in 2017 could also extend, but valuation and timing indicators show high risk. When the monthly RSI (timing indicator at bottom of graph) exceeds 70, turns down, and prices fall below the red support line, a significant correction or crash is possible. Those crashes occurred in 1987, 2000, and 2008. The S&P is ready to make a similar correction or crash in 2017 or 2018. The RSI has reached its highest level in two decades. The S&P 500 Index, DOW, NASDAQ, DAX and many other indices are excessively high, thanks to central bank “stimulus” and QE policies. The monthly chart of the S&P shows S&P prices are in a high risk danger zone. Possible tops have occurred before, but instead of crashing, the market sometimes zoomed higher. Do you own due diligence. Also, read "Hindenburg Omen Meets Titanic Syndrome." However, if you want to believe the S&P is going higher, read “Stock Market Crash … Another Lie.”
Continue reading here. | |
|
| |
| Total comments: 0 | |