9:24 AM How Gold & Silver Will Trade During The Next Market Crash | |
The reason I see the precious metals disconnecting from the broader markets during the next major correction is due to the much different setup today in the gold and silver market than it was in 2008.Precious metals investors forget just how overvalued the gold and silver prices were based on technical analysis. Of course, I am not talking about the true “Store of value” properties of the precious metals, but rather, how they trade in reference to the market in general. As I have stated many times, the paper trading market determines the price of gold and silver, not the physical buyer. Thus, the paper market will continue to control the gold and silver prices until investors realize the dollar is just another worthless fiat currency. In my newest video, How Will Gold & Silver Trade During The Next Market Crash, I use a few indicators to explain why I don’t see a huge crash in the gold and silver prices during the next major market correction:
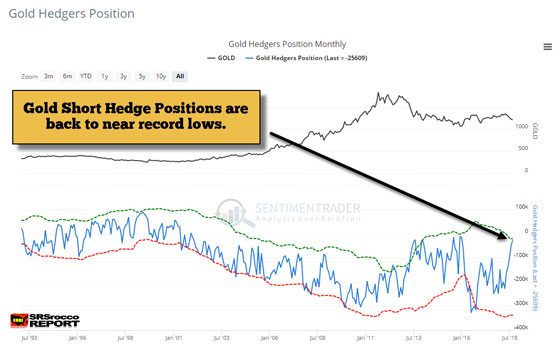
In the video, I discuss how the broader markets are setting up for a significant correction lower while the precious metals are behaving more like a coiled spring. Although, in the initial stages of market meltdown, we could see a broad-based selloff across all markets. However, the technical analysis suggests that the gold and silver prices are much closer to a bottom than a top. Furthermore, another indicator, the Gold Hedgers Chart also provides more evidence that gold is become oversold, rather than overbought:
The gold short hedge position is now back to almost the same level as it was at the beginning of 2016 when gold was trading below $1,100 an ounce. This chart shows that when the gold hedgers position moves back towards the zero line, then the gold price is forming a bottom.
| |
|
| |
| Total comments: 0 | |
