9:14 AM Get Ready for an Historic Upside Gold and Silver Run | |
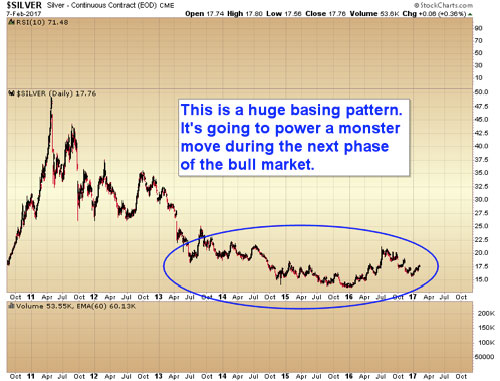
The Bigger the Base, the Greater the Upside Case. This saying among technical analysts/chartists helps define where we are today in the precious metals – and where we'll soon be headed. It means that when prices "base" in a relatively narrow sideways range for an extended period, they will at some point break out. Before the action gets underway, bears and bulls alike will get "sandpapered" as they take positions, trying to guess whether or not the price is getting ready to decline further or move upward into a new bull phase. If you consider that time spent in sideways consolidation represents a build-up in stored energy, then a valid upside breakout will be propelled by a lot of buying fuel as old shorts who bet on lower prices offset their losing positions and new longs jump in to get onboard the change in trend.
Chart by Gary Savage, Editor, Smart Money Tracker. This frustrating sideways movement is not taking place in a vacuum. Bankster manipulation, algo-trading, "fat finger" futures markets' whip-saw behavior, and price chasing in both directions becomes a regular feature of the trading landscape. A long time goes by with neither side having enough trading power to break out of congestion. This takes place concomitant with the central banks' war on cash, currency and trade manipulation, and geo-political brushfires stacking up around the globe. Ongoing strife in Syria, possible war with North Korea and flash points in the South China sea may be classed as severe "low-probability events, but as Jim Rickards says, when taken in total, it becomes highly probable that at least one of them will ignite a crisis, possibility starting a chain-reaction with the others. At some point prices jump the rails, catching most by surprise. By the time the picture clears and Mr. Market decides to provide us with some answers, it's usually too late to climb aboard.
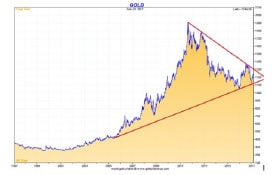
$1300 Gold's "red line in the sand" Given the powerful seven-month rally during the first half of 2016 notwithstanding (followed by a more than 50% give-back over the past year), a lot of gold and silver bugs can be forgiven for coming to believe that they will never see a meaningful, sustained resumption of the exciting days of 2005-6, 2009-11 and early 2016. The feeling of being either "worn out or scared out" – as David Morgan likes to characterize the patience-testing during an extended cyclical bear market wave – has caused more than a few people to sell back their insurance and investment positions in the metals. I believe this is a decision that – sooner rather than later – they will come to seriously regret. Read the entire article here. | |
|
| |
| Total comments: 0 | |